Cartography: Reliving my 20s through hand-drawn maps
This week’s assignment for History & Cartography was to create, first, a hand-drawn map and, second, a map drawn on a computer.
After much indecision, I chose to hand-draw a portion from an 1836 map of the town of San Antonio de Béxar and its nearby mission-turned-fort, the Alamo, by Mexican Army Colonel Ygnacio de Labastida. Although the map is inaccurate because it exaggerates the size of the Alamo, I nonetheless thought it would be interesting to produce a version of it. Since Labastida was a military engineer, and his enemy was holed up in the Alamo, perhaps it is no surprise he would exaggerate the size of the Alamo in comparison with the town of San Antonio de Béxar.
Here is the original:

I printed out a version of the map (on my black-and-white printer) and proceeded to draw a grid over the portion showing the town of San Antonio and the Alamo. By chance, I chose a 4.5 inch by 6 inch portion–perfect for blowing up into a 9 inch by 12 inch sketchbook. So I then, essentially, doubled the size of my printout. I free-drew the map to correspond with the grid, then covered the lines in ink and used a fancy eraser to (mostly) get rid of the pencil. I then used some basic colors for it, different from those used by Labastida. Importantly, I chose to use green as the background. This harkened back to my days working at the Alamo in my early 20s: visitors were commonly surprised by how green San Antonio was, due to John Wayne having filmed his movie in the desert. So I wanted to show that. Here’s the finished product:
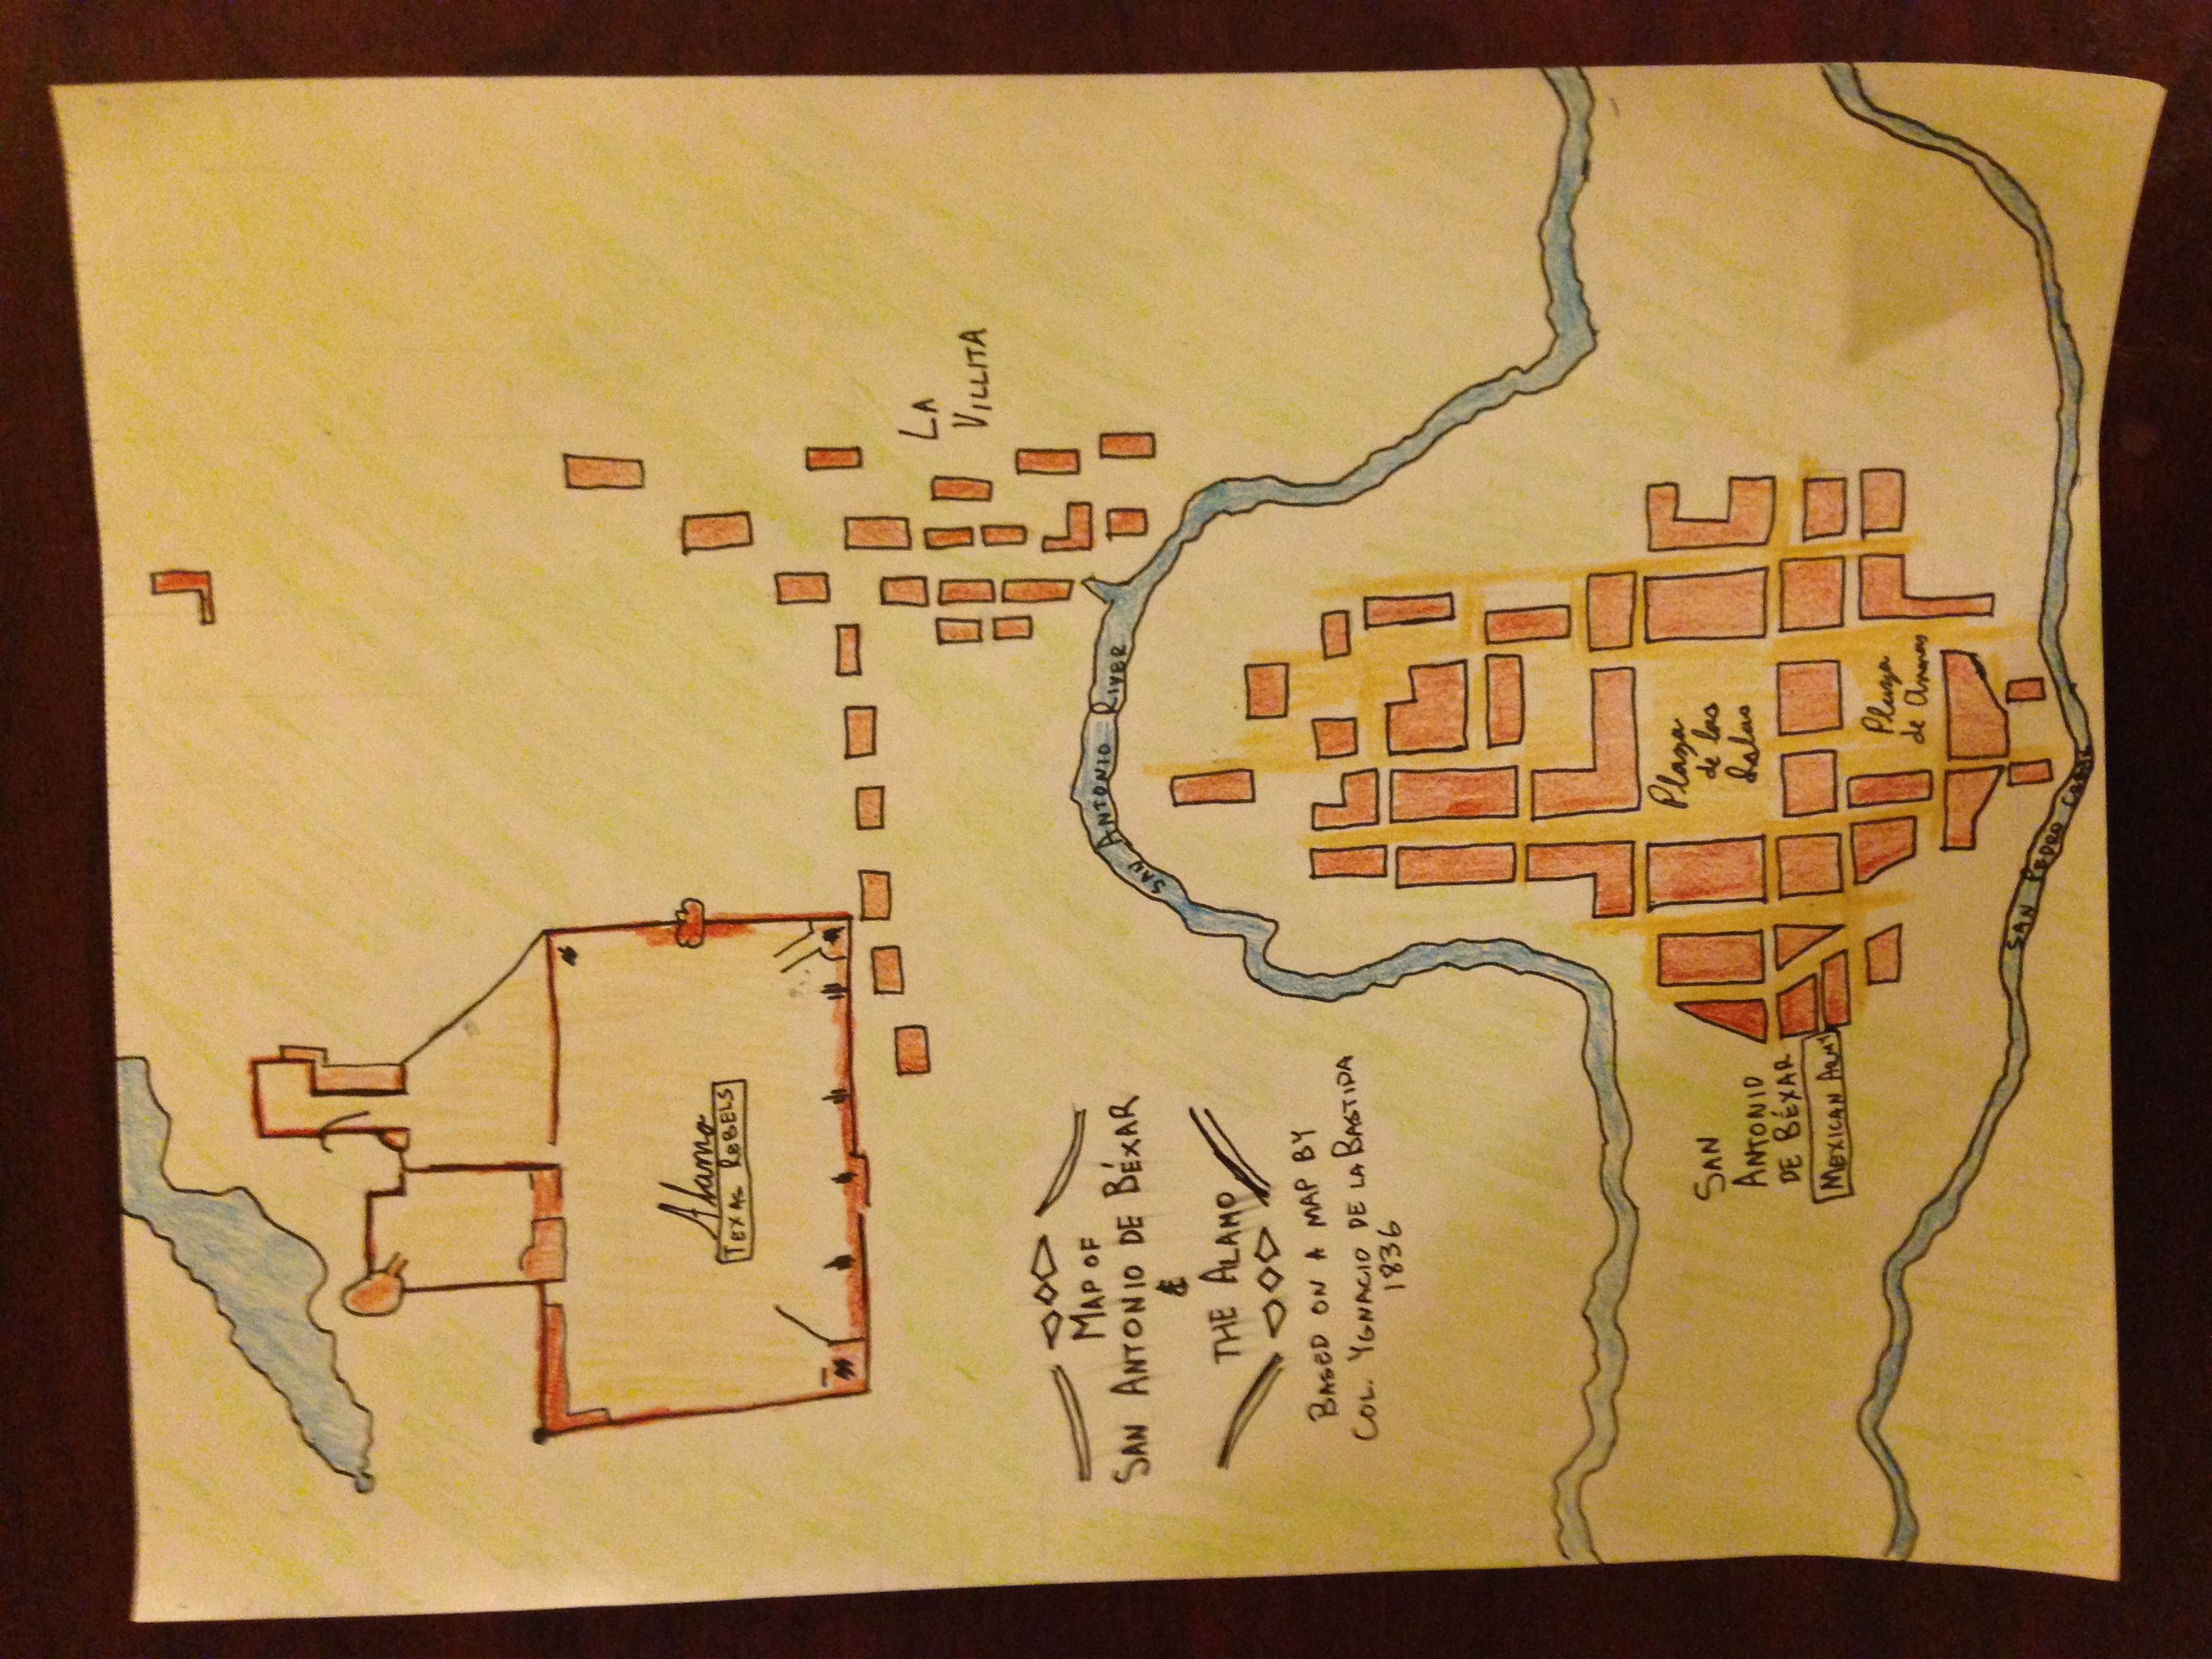
I definitely don’t have the cartographic skills, especially with my hands, of a Mexican Army engineer. Indeed, in doing this exercise, I gained appreciation for the skills of cartographers, particularly before the age of computers! Like others have said, I certainly learned that my art skills are lacking…
This exercise also helped me study the map more closely. When coloring it in, in particular, I had to choose how much to reflect the accuracy of the Alamo (with buildings on the walls, not just walls) or to keep with Labastida’s map. In the end, I chose to show the buildings, somewhat.
Perhaps a better exercise would have been correcting Labastida’s map, but that can be for another time.
For the computer portion, I chose to relive another part of my early 20s: my time as a Peace Corps volunteer in El Salvador. Before leaving in part for medical reasons, I spent seven months in a small community called El Llano, six miles from the town of Sensuntepeque, capital of the northern department of Cabañas. El Llano is part of a broader community called San Lorenzo.
Not surprisingly, most Salvadoran villages don’t show up on Google Maps or Google Earth. After much trying a couple of years ago, I finally was able to locate El Llano, mainly because of its cemetery. Here is El Llano in Google Maps:
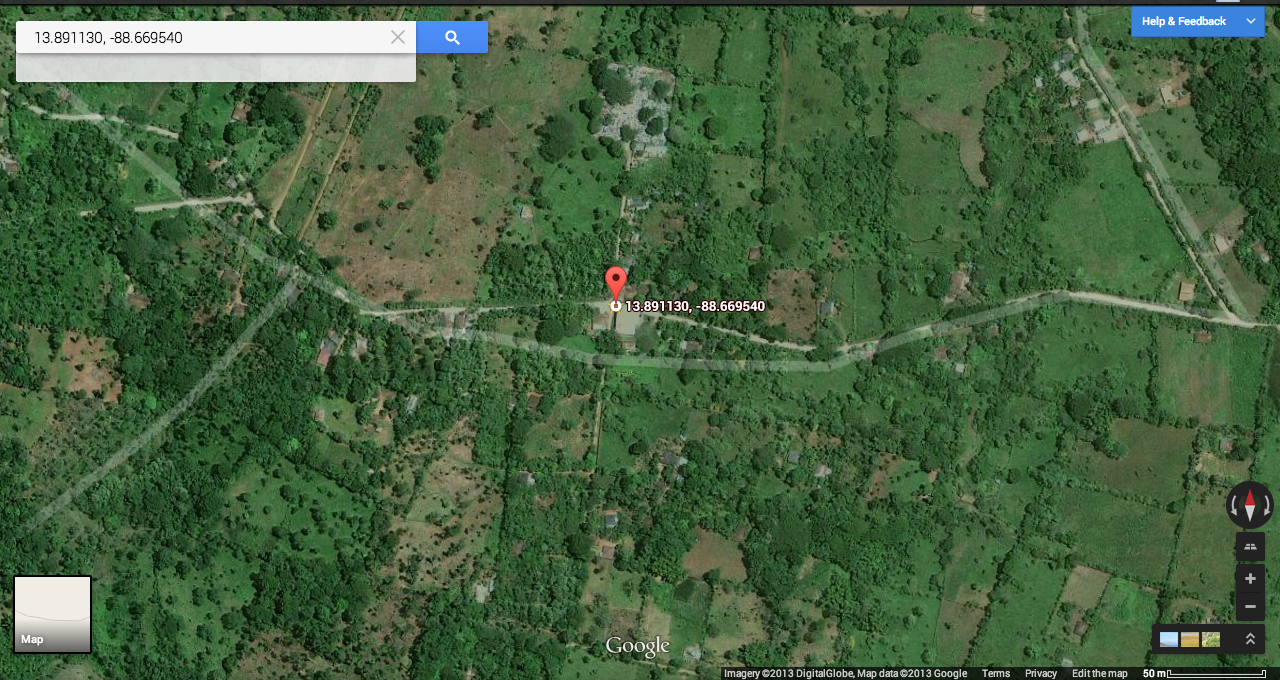
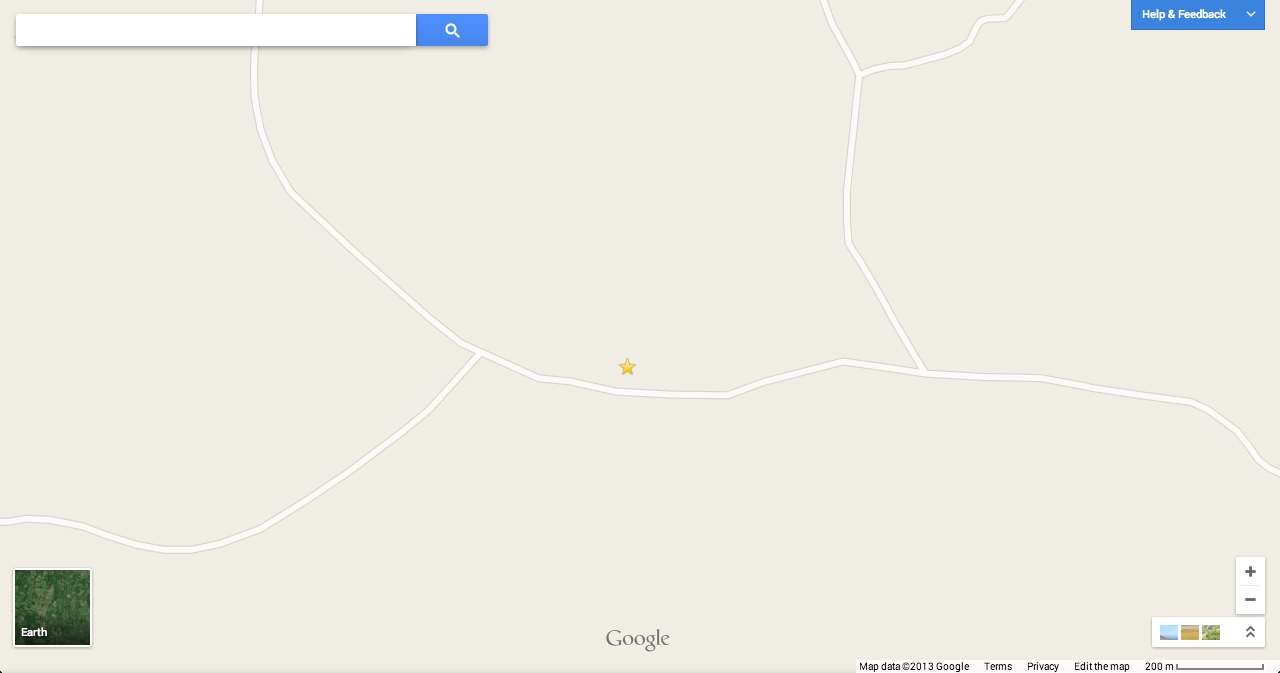
As this image somewhat shows, the sole map element that Google Maps provides here–the roads–don’t even line up to the reality of where roads run through the community. Not using the Earth feature, there’s even less:
So, I decided to add some depth to the village in my map, showing, in particular, homes, shops, civic institutions, and locations of wooded areas, which then show where farm fields are. In this case, I traced over the Google Earth view in Illustrator. Here’s the result:
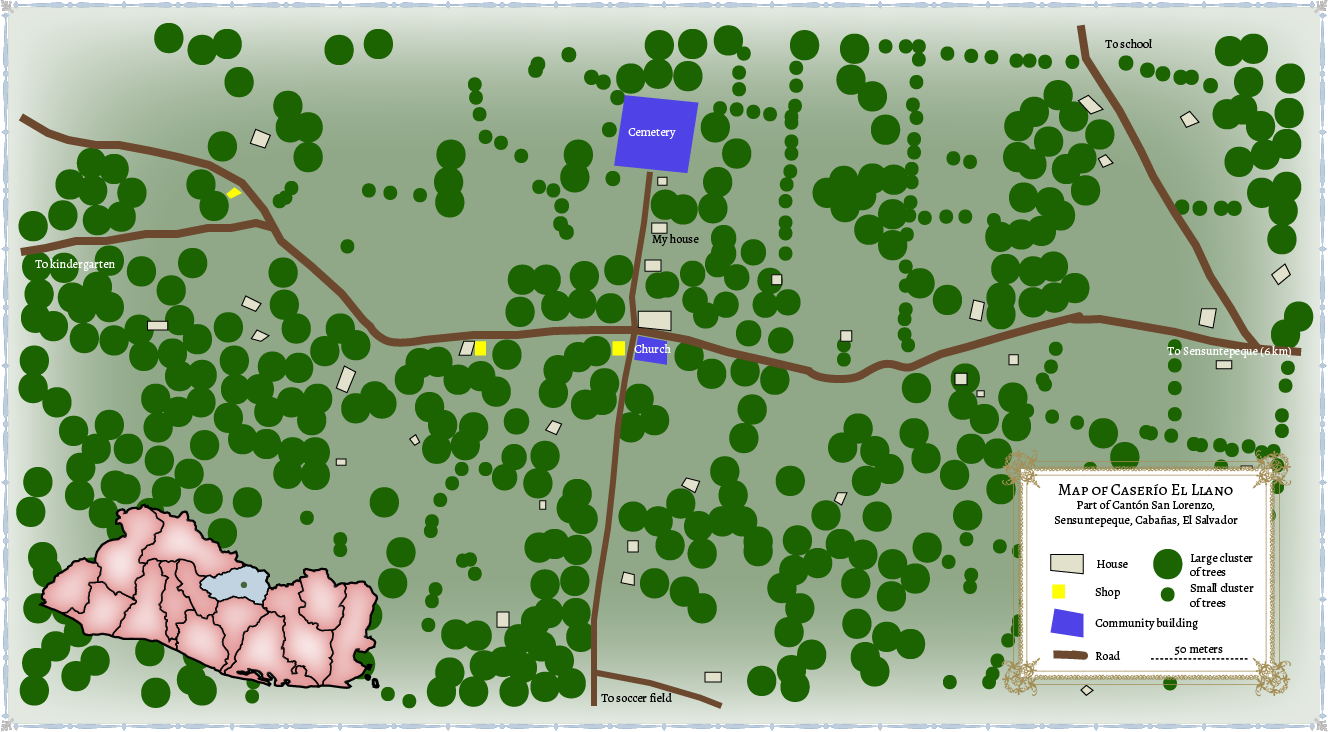
With this map, I had some choices to make–specifically, how literal to make it. I considered making the houses one symbol, and equal size. However, I also thought it best, because this is at such a small scale, to show the true sizes, and the dispersal of the population. I also showed the shops, which, in every case, operate out of people’s houses. The building functions are based on my memory from ten years ago; I last visited in 2005, so presumably things have changed. With trees, I chose a more figurative rendition, using small and large circles for clusters of trees. I did choose the color of the roads based on the deep red soil that exists in that region of El Salvador, though.
Since my experiences in El Llano were, literally, on the ground, it was interesting for me to do this map and see how the community is laid out. The distances between houses didn’t seem so far to me when walking as they appear on the map, but now, looking back at it, things were rather spread out… I also wasn’t sure whose property was whose, so I chose not to put that. For someone using a map like this to, say, understand land tenure, particular after the country’s civil war-inspired land reforms in the 1980s, this map would not do. But it does show population dispersal in a Salvadoran village from that time period, and for that, I hope it is of value.